Prometheus Metrics
File: app/core/metrics.py
Available at GET /metrics (no authentication required — public endpoint). Uses a dedicated CollectorRegistry — not the default global one.
Metrics
inference_requests_total
Type: Counter | Labels: model, version, tenant
Incremented once per request before execution. Counts both successful and failed requests.
inference_errors_total
Type: Counter | Labels: model, version, error_type, tenant
error_type |
Cause |
|---|---|
model_not_found |
No pipeline registered for (model, version) |
timeout |
Executor timed out |
inference_error |
Any other exception during pipeline execution |
inference_latency_seconds
Type: Histogram | Labels: model, version, tenant
Buckets: 0.005, 0.01, 0.02, 0.05, 0.1, 0.25, 0.5, 1, 2, 5, 10
End-to-end latency: preprocessor → validator → model → postprocessor.
executor_inflight
Type: Gauge | Labels: device
Inference calls currently executing in the thread pool.
executor_timeouts_total
Type: Counter | Labels: device
Incremented each time an executor times out.
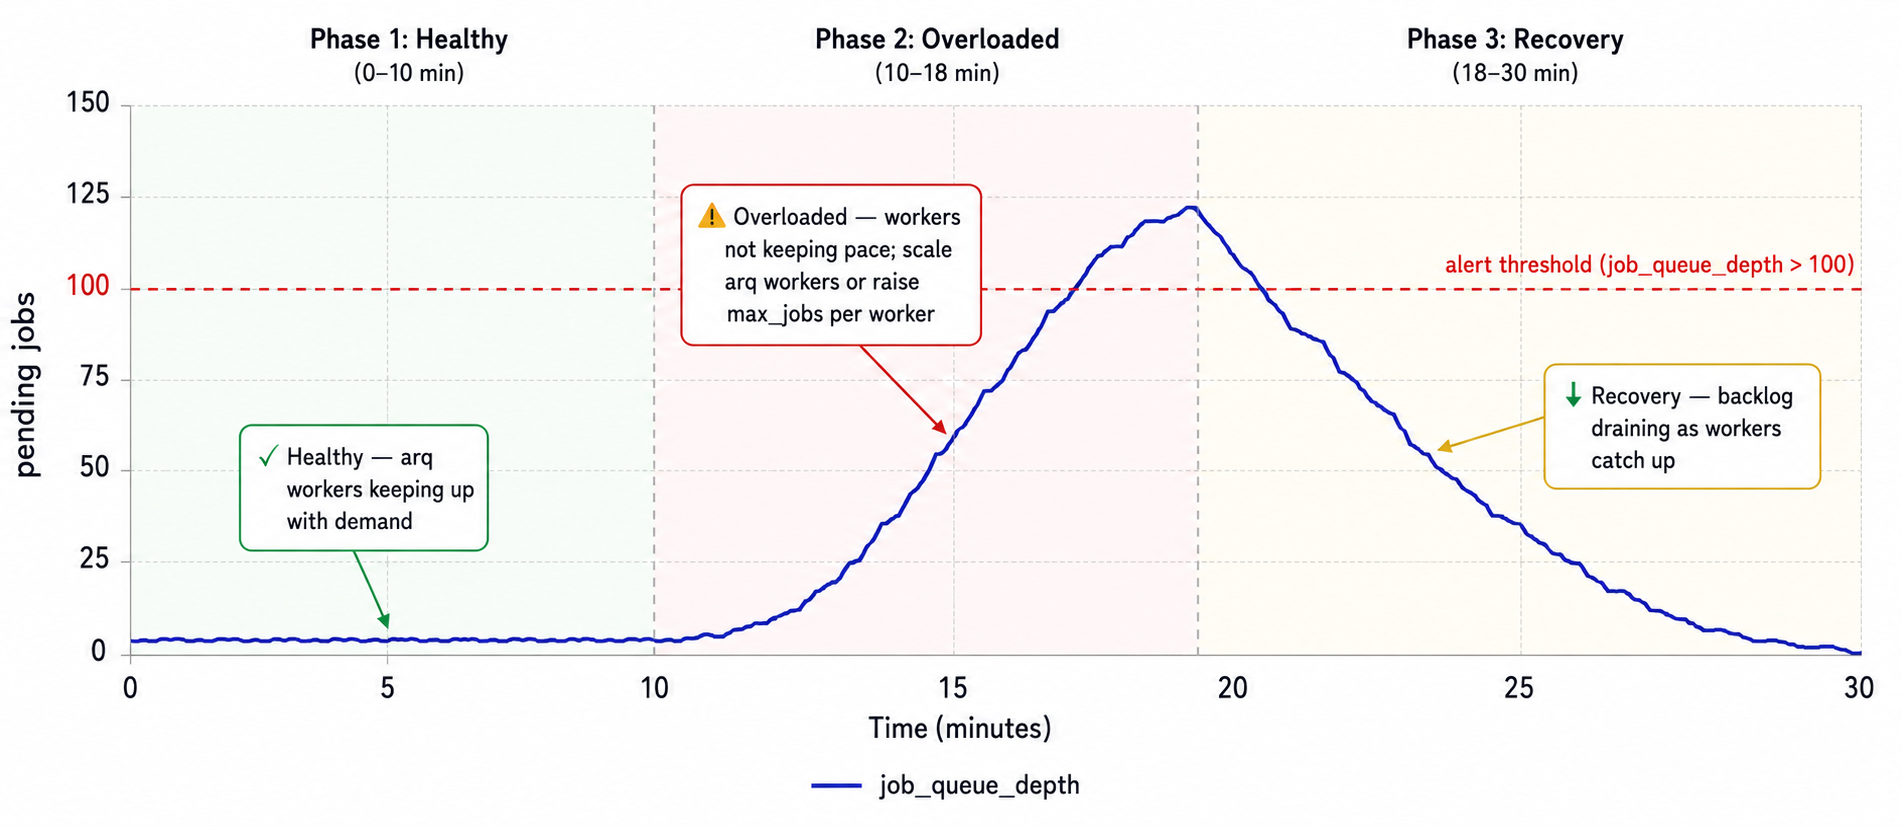
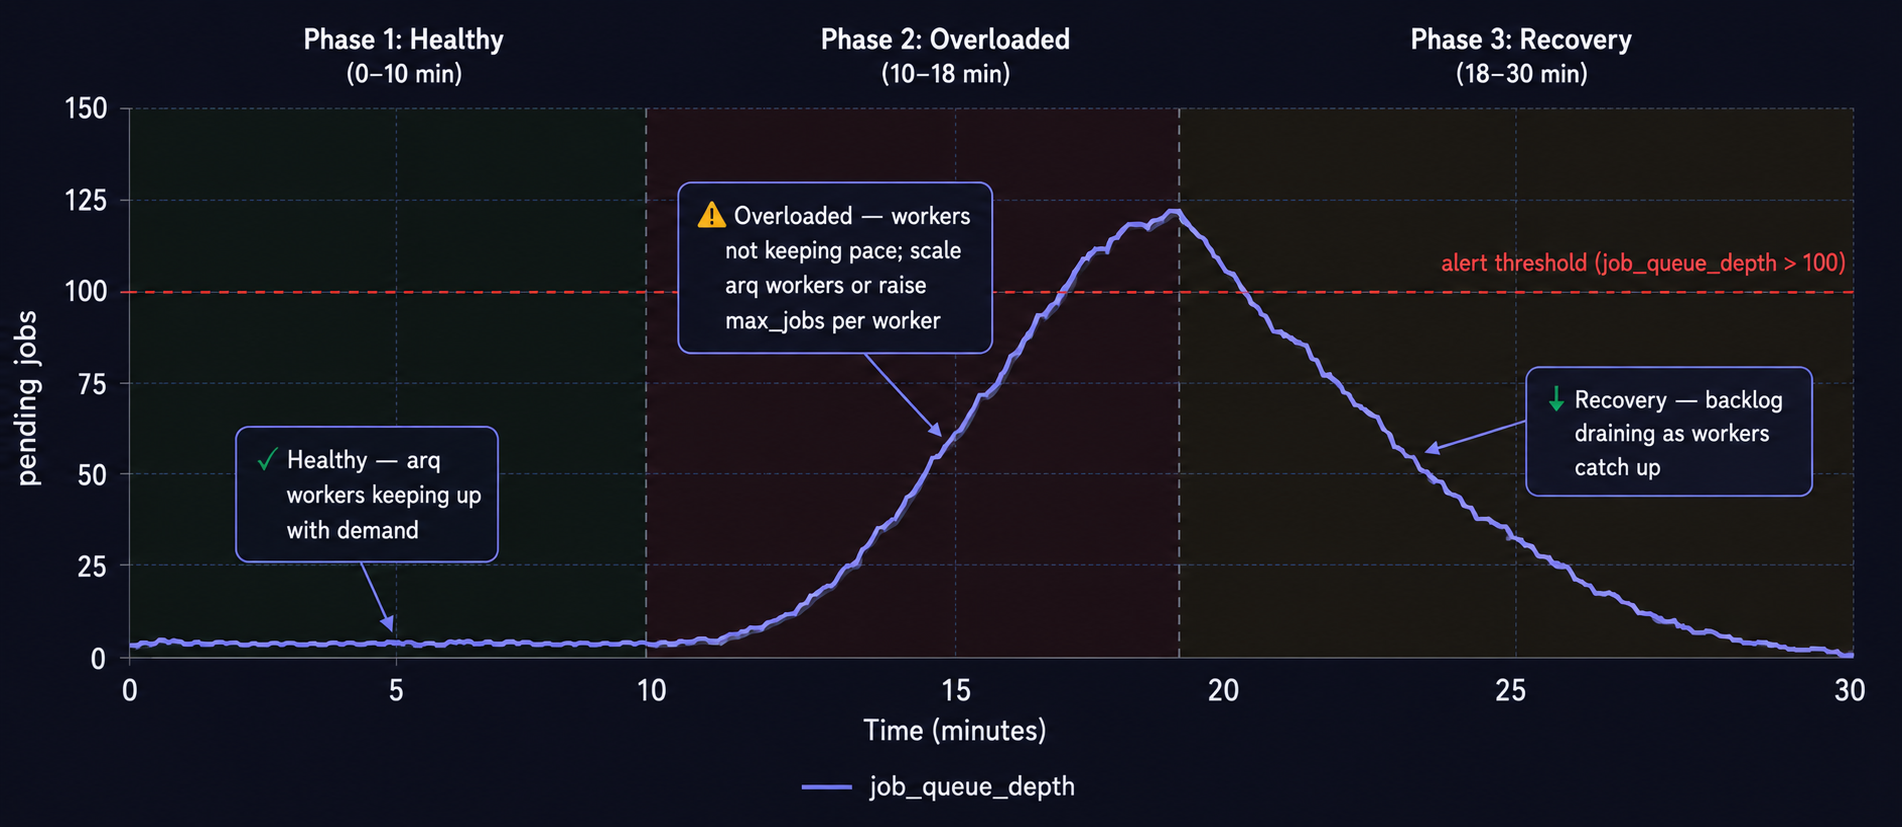
job_queue_depth
Type: Gauge | Labels: model, version
Number of jobs currently in PENDING state — waiting to be picked up by a worker. Incremented in JobService.create_job(), decremented in JobService.mark_running().
This is the primary capacity planning signal under async load. A rising queue depth means workers are not keeping up.
Recommended alerts
| Alert | Query | Threshold |
|---|---|---|
| High error rate | rate(inference_errors_total[5m]) / rate(inference_requests_total[5m]) |
> 5% |
| High p99 latency | histogram_quantile(0.99, rate(inference_latency_seconds_bucket[5m])) |
> 2s |
| Timeout spike | rate(executor_timeouts_total[5m]) |
> 0 |
| Queue depth growing | job_queue_depth |
> 100 |