Monitoring Setup
Prometheus
Metrics are available at GET /metrics — no authentication required. The endpoint is public so Prometheus can scrape without credentials.
Production
In production, restrict access to /metrics at the network or reverse-proxy level rather than at the application level. Do not expose it to the public internet.
Docker Compose (included)
The project ships a pre-configured Prometheus in docker-compose.yml under the observability profile:
Or, to add observability to an already-running stack:
Prometheus is available at http://localhost:9090.
External Prometheus
Add to your prometheus.yml:
scrape_configs:
  - job_name: inference-engine
    static_configs:
      - targets: ['localhost:8000']
    metrics_path: /metrics
No auth header needed.
Recommended alerts
| Alert | Query | Threshold |
|---|---|---|
| High error rate | rate(inference_errors_total[5m]) / rate(inference_requests_total[5m]) |
> 5% |
| High p99 latency | histogram_quantile(0.99, rate(inference_latency_seconds_bucket[5m])) |
> 2s |
| Timeout spike | rate(executor_timeouts_total[5m]) |
> 0 |
| Queue depth growing | job_queue_depth |
> 100 |
Grafana
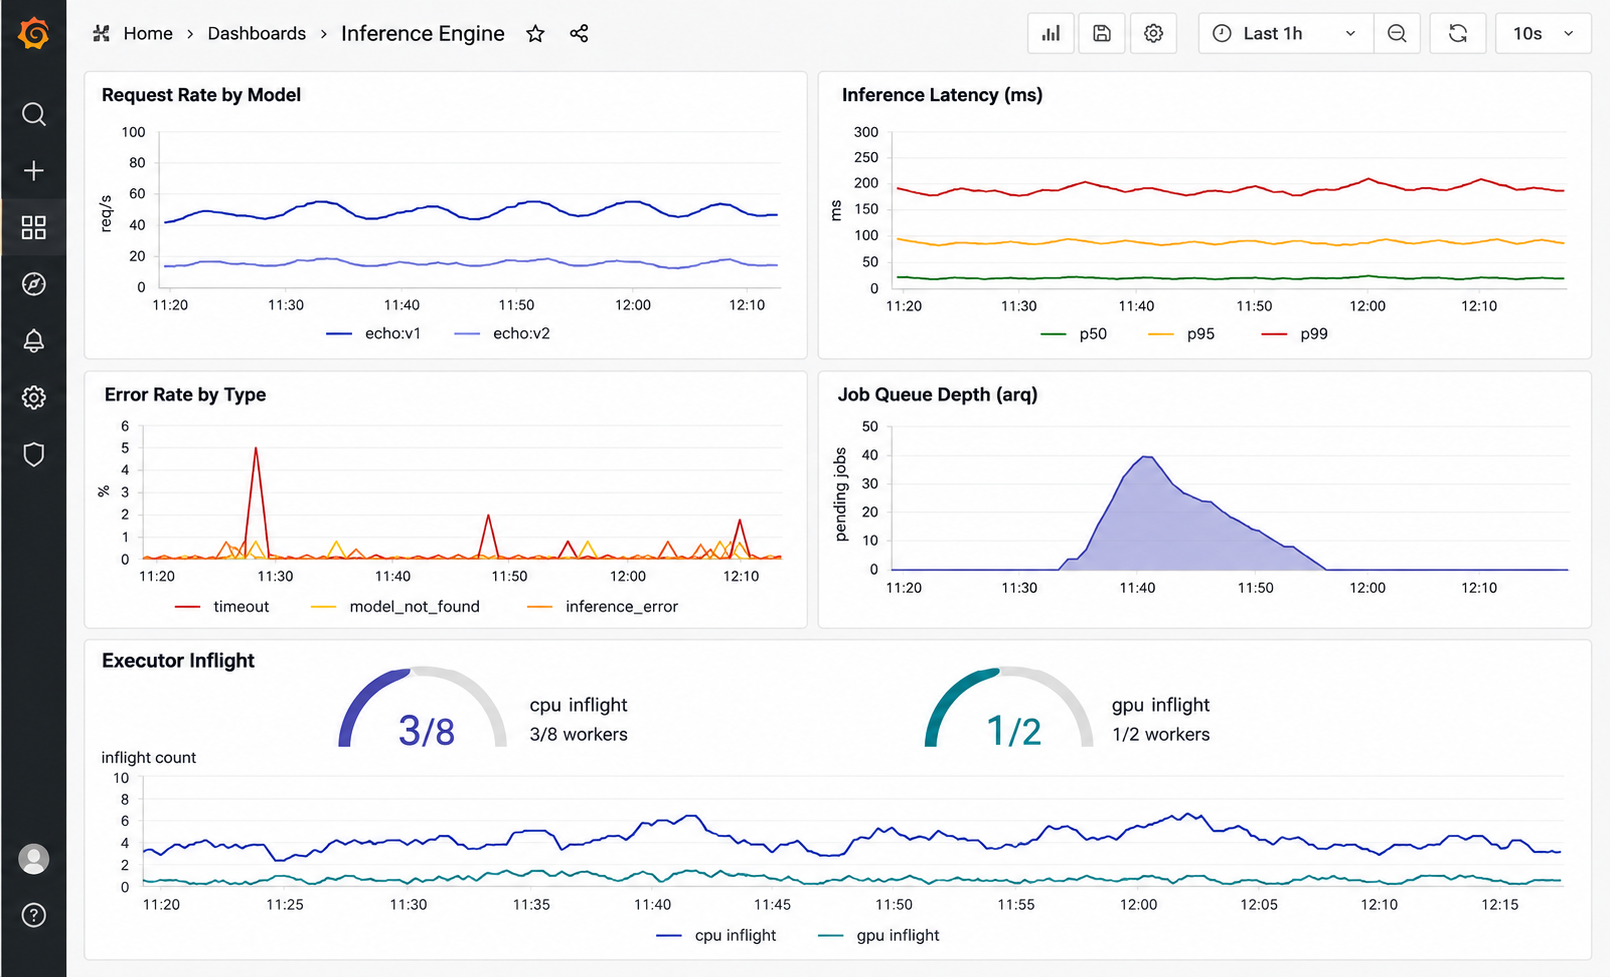
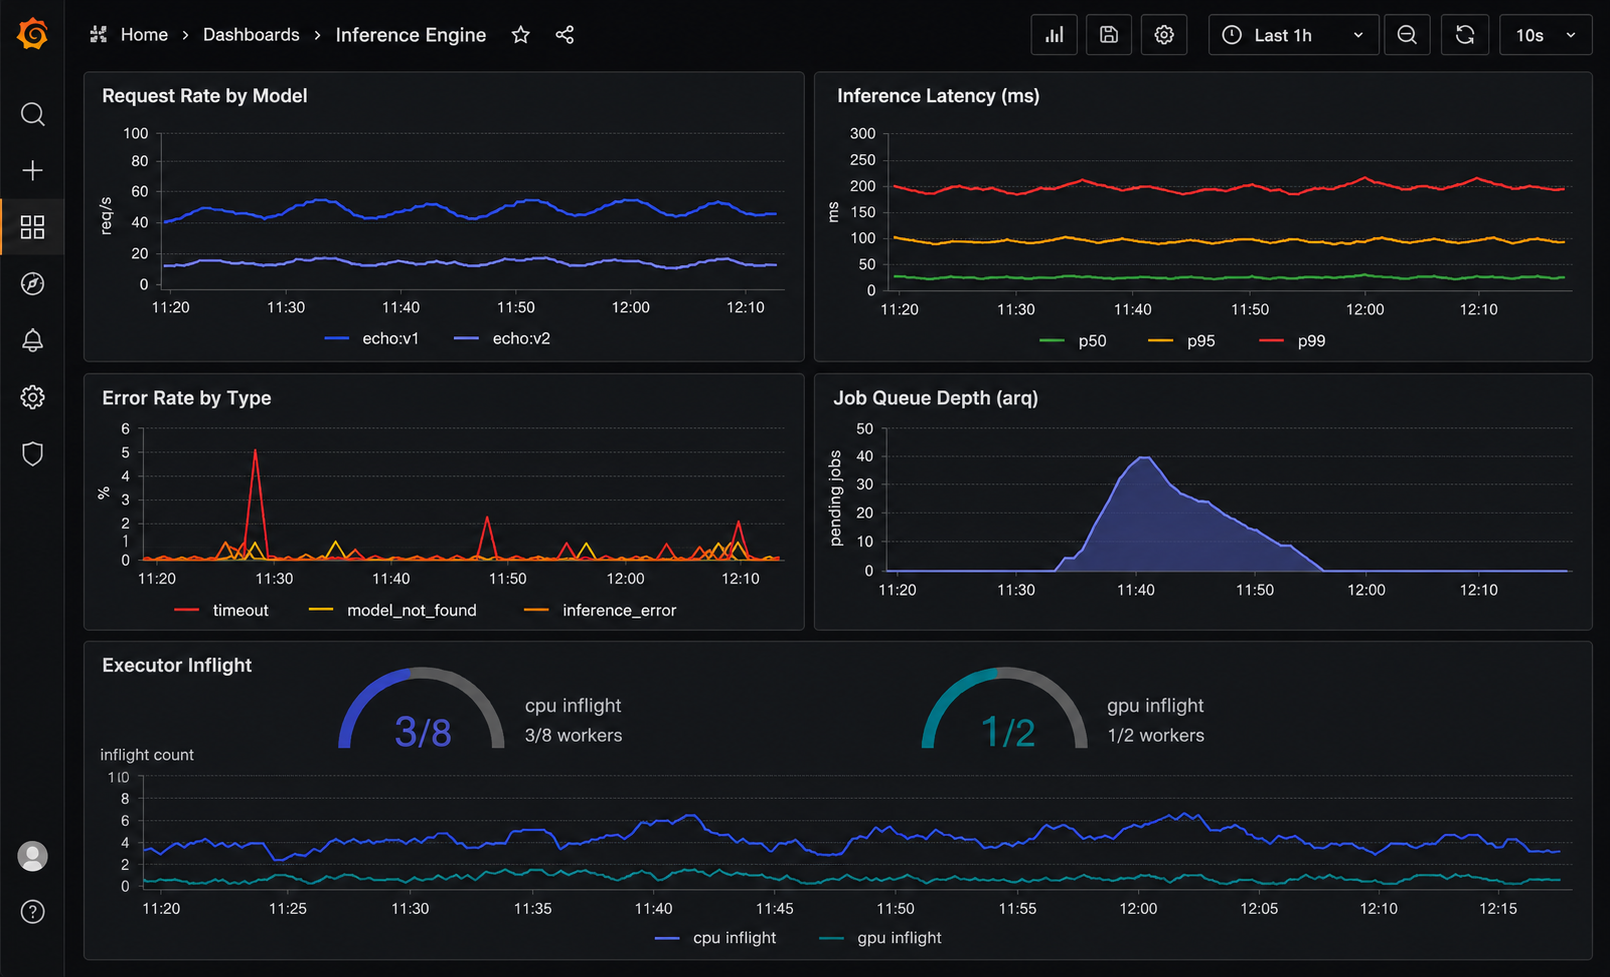
The project ships Grafana pre-provisioned with the Prometheus datasource. Start it with:
Or alongside an already-running stack:
Grafana is available at http://localhost:3000. Default login: admin / admin (override with GRAFANA_PASSWORD in .env).
Use Explore → Prometheus to query metrics. Key queries:
- Request rate:
rate(inference_requests_total[1m]) - p99 latency:
histogram_quantile(0.99, rate(inference_latency_seconds_bucket[5m])) - Error rate:
rate(inference_errors_total[5m]) - Queue depth:
job_queue_depth
Log aggregation
All logs are JSON on stdout. Ship to your collector without additional parsing:
Use request_id to correlate log lines with job records and OTel traces.
Distributed tracing
See Tracing for OpenTelemetry setup with Jaeger or any OTLP-compatible backend.